|
Project Description
|
Project Site Layout
The demonstration project design of the study consist of 51 plots, 3 plots evaluating a traditional commercial fertilizer product plus a 48-plot randomized block study consisting of three blocks with each evaluating two phosphorus sources (one biosolids and one chicken manure) applied at 4 treatment levels, with and without an alumn-base water treatment plant residual. (See page 11 of the Plan for details)
The layout of the demonstration project plots has been selected based on a combination of site constraints and project needs. Site constraints include available land, ditching patterns, soil variability, roadways, residuals permit conditions, etc. The dimensions selected for the plots affects several project factors including ditch construction and maintenance costs, fencing costs, runoff variability as dictated by rainfall patterns, runoff magnitude as affected by ditching density, harvesting patterns and costs, and residuals application patterns and costs.
The Layout process was a long iterative process. Below we show the results of this process, which correspond to what is built on site. To learn more about the layout process go to the
> Progress report on layout process 12-18-2001
> Ditch construction methodology 12-24-2001
Final layout
Definitions
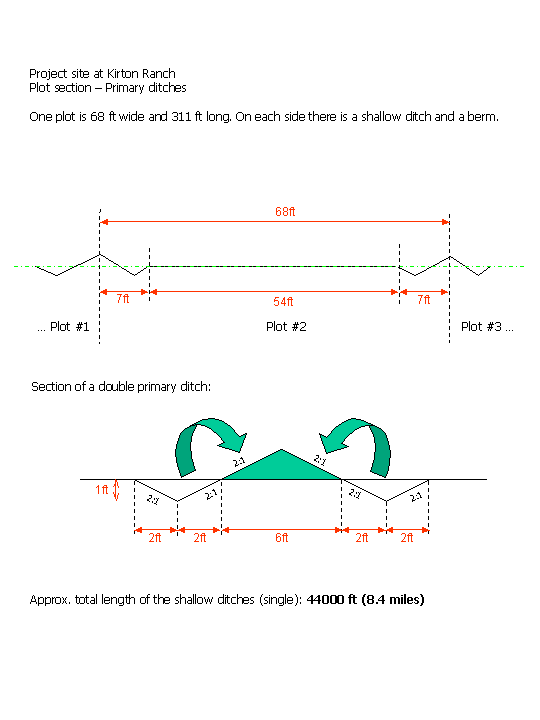
The primary ditches are defined as the
small ditches that collect the water of one single plot and deliver it to the
water sampler.
The ditches that collect the water from one block of 17 plots, after the water
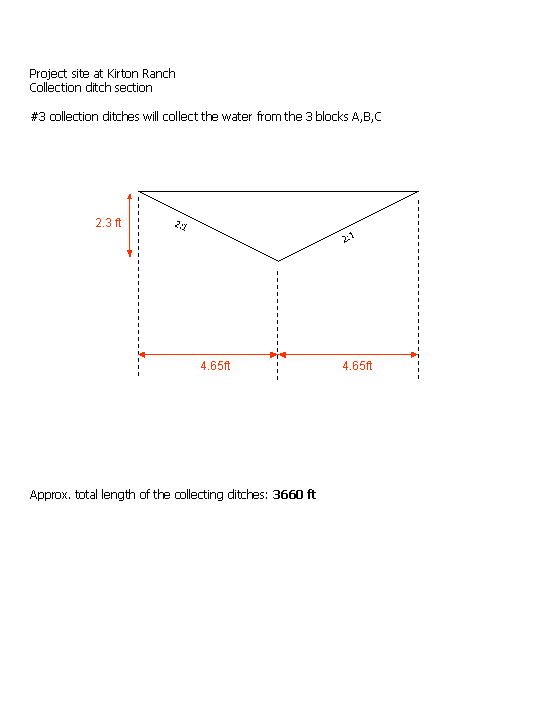
samplers are defined as secondary ditches.
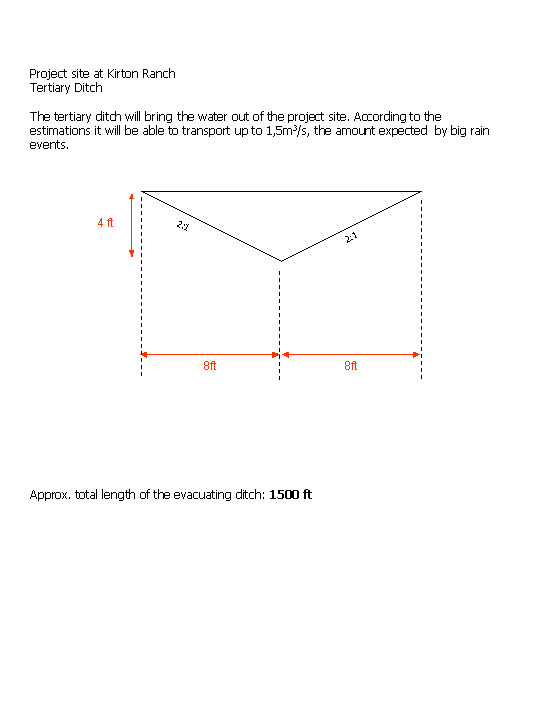
Tertiary ditch is the ditch that evacuate all the water from the three
blocks.
Basic dimensions
The demonstration site consist of 3 parallel blocks of 17 plots.
| Plot length | 311 ft |
| Plot width | 68 ft |
| Plot Area | 21148 square feet (approx. 1/2 acre) |
| Block length | 1156 ft |
| Block width | 311 ft |
| Block Area | 359516 square feet |
The plots are N-S oriented to better turn to
account the natural slope of the field. Other factors that influenced the design
are listed above.
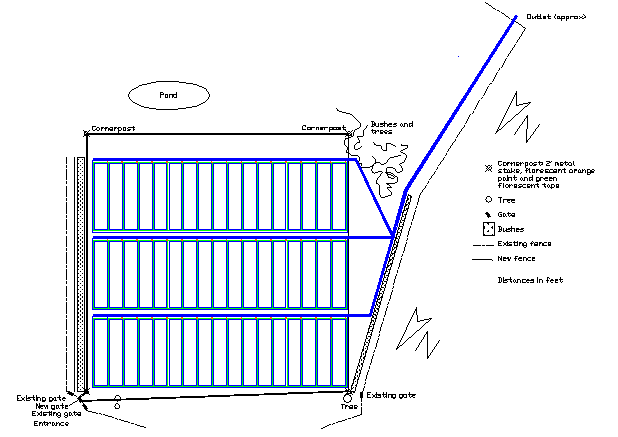
On the following map the plots are green, the
ditches are blue and the red
dot represent the position of the water samplers. This map is available as
autocad file for download
Actual Dimensions
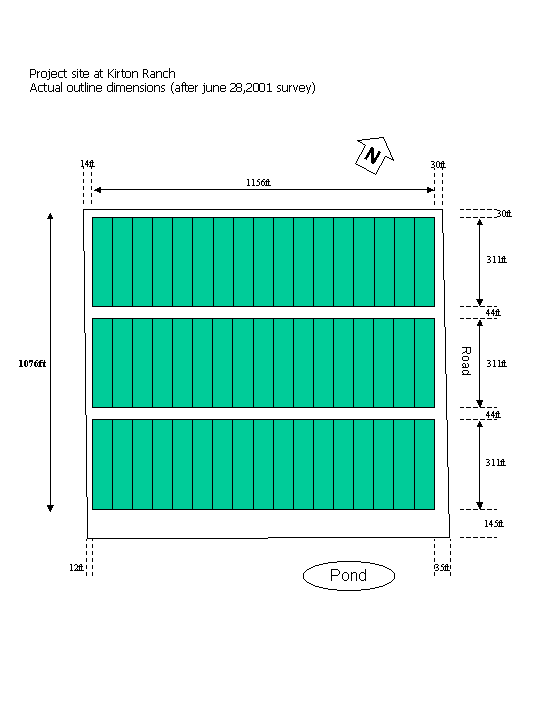
Different reasons may cause the reality to be different from the plans. The following diagram contains the dimensions that were actually measured on site. The last update of this diagram is dated June 28, 2001, as the fence was built and the construction works were going to begin.
Plot identification
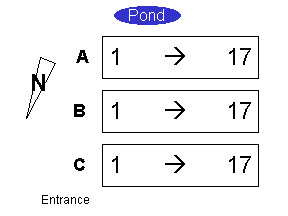
For the all project the plots and their relative equipment should be identified using the following notation:
Primary ditches dimensions / single plot layout
Secondary ditches
Tertiary ditch
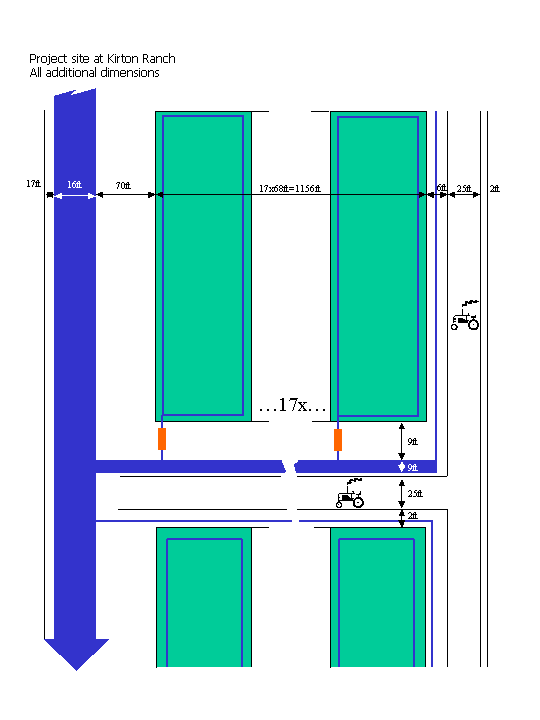
Additional dimensions
The distances around the plot blocks are determined by different factors: there must be space enough for the secondary and tertiary ditches, for the tractor to access the plots, for the water samplers and their maintenance and to build shallow isolating ditches around the blocks. Refer to the diagram below.
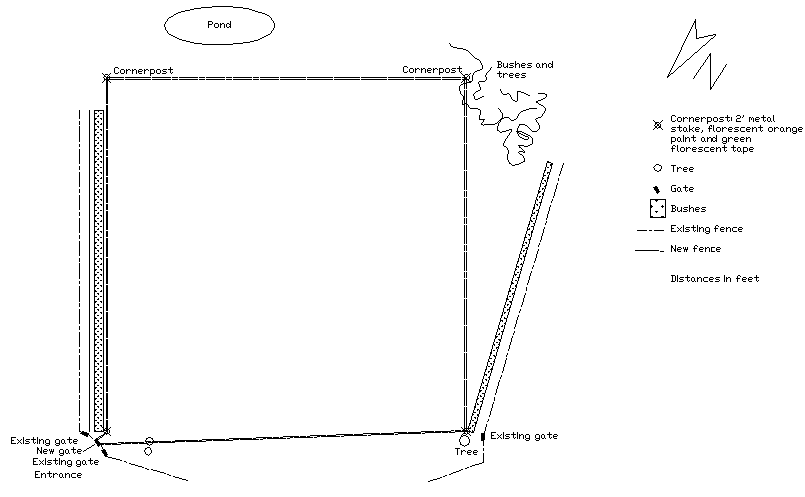
Fencing
The field of the demonstration project is protected by a hog proof fence. The fence is marked on the map with a double dashed line. There is one entrance gate to the field (lower left corner of the map, near the vehicle park).
Position of the water samplers
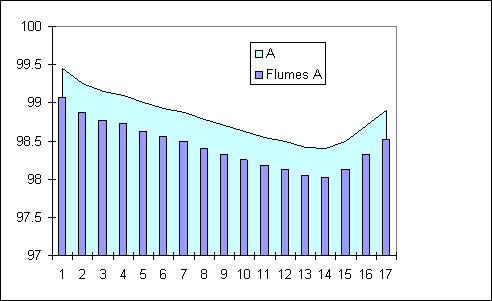
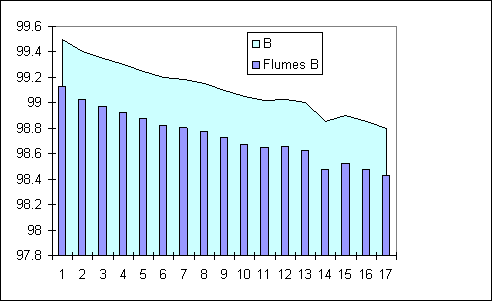
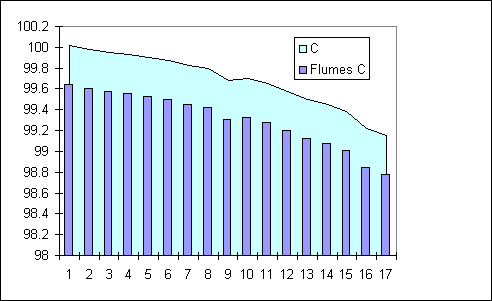
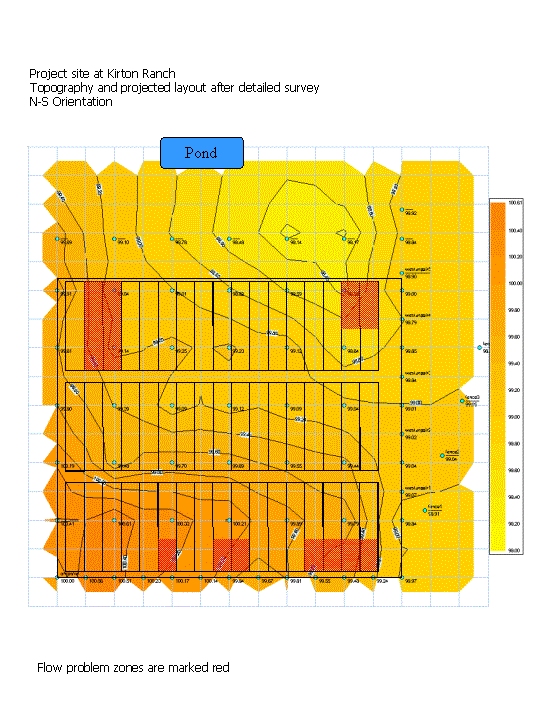
The horizontal position of the samplers is given on the map above. In the vertical dimension the water samplers are set to have the flumes bottom 4.5" below the average ground level. The ground level was determined by interpolating the leveling data (see level map). The diagrams below show the interpolated ground level and the position of the flume's bottom of the 17 water samplers of each block.
> Download the excel source file